The Study
To test (or maybe rather get some first impression), whether it is possible to predict subjective experiences of fatigue, for 35 days we (1) took two muscle measurements (see protocol) - one in the morning after waking up, one in the evening before going to bed and (2) filled out a questionnaire (see survey).
We had three main outcomes of interest:
- Overall fatigue [1-7]: Experienced level of fatigue throughout a day. Did we feel tired and worn out? Or rather energetic and motviated?
- Muscle soreness[1-7]: Experienced level of muscle soreness throughout a day across the body. Were there any muscles that felt stiff or aching? Or did they rather feel 'fresh'? Supposed to relate to the physiological concept of peripheral muscle weakness (peripheral fatigue) (see Davis, 1999 ).
- Muscle tiredness[1-7]: Experienced level of muscle tiredness throught a day across the body. How 'worn out' did your muscle feel, how much willpower did you need to move? Supposed to relate to the physiological concept of central nervous system muscle fatigue (see Davis, 1999 ).
For the remainder you can pick a person whose data you want to explore:
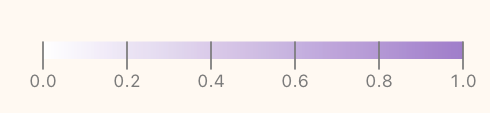
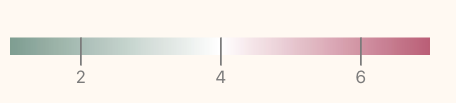
The below plot shows the three main outcomes of interest over time: overall fatigue, muscle soreness and muscle tiredness. Everyday we retrospectively assessed or subjective experience of those. Values range from 1 (= very low) to 7 (= very high). It further shows the levels of some other variables in relation to their respective maximum, e.g. if step count is dark purple, the number of steps on that days was close to the maximum number of daily steps measured during the study period.
Predictions based on Survey Data
Are there patterns in our wellbeing that we aren't conciously aware off?
In a first step, we explored whether we can predict subjective experience of fatigue, muscle soreness and muscle tiredness for the next day based on information collected through the questionnaire the day before. We tested several machine learning models and compared them to (1) our own prediction of how we would feel the next day and (2) always predicting the mean level.
Predictions for
Models
Model Selected:
Overall Fatigue
Muscle Soreness
Muscle Tiredness
Results
Well... it seems like fatigue levels and behavior are not too much indicative of the next days' fatigue levels.
Amanda
Generally speaking, Amanda's predictions of her muslce soreness & tiredness levels for the next days, were slightly worse than just always predicting the mean level observed within the previous month. For the overall fatigue level her own predictions were slightly better - mostly Amanda is a bit too pessimistic.
When it comes to the different models, in terms of absolute error, all of them perform worse than just always predicting the mean.
Johanna
Generally speaking, Johanna's own predictions for overall fatigue and muscle tiredness were worse than always just predicting the mean. For muscle soreness, her predictions were fairly accurate - at least better than all machine learning modelsor simply choosing the mean.
When it comes to the different models, standard random forest performed best for overall fatigue and muscle tiredness. However, it only slightly outperformed always predicting the mean value. While it was quite a bit better than Johanna's own predictions, looking at the SHAP values tells us that Johanna's prediction for the next day nonetheless was the most important variable for predicting. For muscle tiredness also scoring high on the item 'I felt fit' actually increased the likelihood of high muscle tiredness the next day, indicating that feeling fit and potentially moving a lot might have negative effects on muscular fitness the day after. For muscle soreness, lasso regression performed best - looking at the coefficients tells us that, somewhat non-surprisingly, doing HITT exercise was the most relevant predictor of muscle soreness.
Note: We also tested a standard linear regression model but it performed even worse than any of the more complex models, thus results are not includeded here. However, it is included in the code .
Predictions based on muscle data
In addition to the daily survey data, we also collected sensor data about muscle activity twice a day, using an EMG & MMG sensor kit , following a strict protocol . A large body of literature has been trying to use these types of data to assess and/or predict (muscle) fatigue (see here for a great literature review or here for our summary) - with varying success.
Based on the existing literature, we developed a protocol that we hoped would allow us to gather data with high enough quality to be of use while still being short and easy to follow such that we could integrate it in our daily schedule.
Pre-Processing
In a first step, the EMG and MMG data was pre-processed. In this case we (1) substracted the mean and applied a bandpass filter with a lower bound of 50 and an upper bound 450 Hz, (2) rectified the signal and (3) performed amplitude normalization. The last plot also shows the starting points of the different phases in the protocol , where 'M' stands for muscle contraction.
In the next steps, we extracted features, i.e. transformations of the signal based on the features that have been reported to be predictive of muscular fatigue in previous studies. Those were always extracted for sub-signals of a length of 250ms (as recommended by previous literature), i.e. each measurement recording was 'chopped up' into many smaller instances.
Predictions
We used those to train two different types of models: a neural network and a random forest model. Both were trained to predict for every sub-sequence and the final result, i.e. the prediction of fatigue for a particular day as obtained by averaging over all the predictions for that day based on each subsequence. Apart from the features extracte from the signal the models were also given indicators for which interval of the recording a subsequence belonged to (e.g. wallsit) and whether the recording had been created in the morning or evening.Results
Overall, the muscle data based models performed as badly as the models based on the survey data and our own predictions. There are existing studies using EMG and MMG data to predict (muscular fatigue), however, all of the ones we found were focused on the particular moment of data collection, i.e. predicting e.g. the onset of fatigue during an exercise or contraction based on real-time EMG measurements. This is contrary to our exploration where focused on predicting a general 'state' of muscle impairment and wellbeing. Thus, one conclusion that we might draw is that the electrical activity in the muscle's response to a neural stimuli is not indicative of it's more general state. Alternatively, it could also be the case that it is indeed indicative but our subjective experience of (muscle) fatigue is not related to the actual, physical fatigue state. However, various studies focusing on measuring muscle fatigue have successfully used questionnaires to determine fatigue thresholds. Consequently, we consider the first explanation as more likely.Predictions for
Models
Overall Fatigue
Muscle Soreness
Muscle Tiredness
Discussion
Of course there could be different reasons why we aren't able to predict next day fatigue very well:- The things measured in the survey are not relevant: It could be that there is just not a lot of predictive value in the survey data, i.e. the variables that we have collected are not related to the fatigue levels of the next days. This means that (1) the subjective level of fatigue and muscle impairment on one day is not very much related to the levels experienced on the next day. Looking at the auto-correlations (code for plotting those is included in the code ), this can be confirmed - while there is more auto-correlation than one would expect from a random walk, there is only a very weak correlation (~0.2) for muscle impairment and inconsistent correlations for the fatigue measure. Further, (2) the other collected variables also don't play a big role for determining fatigue and muscle impairment, i.e. whether we did sports, drank alcohol and/or a lot of coffee was not particularly relevant for our wellbeing on the next day. This means that there is probably other factors determining this - these could be some factors that we have overlooked (e.g. nutrition, weather) or factors that are hard to quantify (e.g. stress, mood).
- The sample size is just too small: All of the relationships we are trying to analyse are at best probabilistic, i.e. there for sure does not exist a deterministic 'law' like e.g. sleeping less than 6 hours always results in a fatigue level higher than 5. What is more realistic is that sleeping less than 6 hours will make it more likely that we observe higher fatigue levels the next day. However, due to this high uncertainty level and interactions of variables, we might just not have enough power to detect relationships, i.e. maybe there are small to medium effects and if instead of 35 days we had data collected for a whole year, models might be able to pick up those patterns.
- We didn't pick the 'correct' prediction models or made a mistake: While we did our best in trying out different, commonly used frameworks there, of course, exist other models, different ways of pre-processing, different hyperparameter settings etc. that could have resulted in different outcomes - and who knows - maybe been doing a better job in making sense of the collected data. Both of us are far from being experts in signal processing / machine learning / medicine etc. - while we certainly took a deep dive into these topics, there anyways could have been crucial factors that we haven't taken into account. Additionally, there is also still the possibility that we made some errors along the way - feel free to look at our code and let us know if you spot any.
- It's just unpredictable: Maybe, even if we could gather all the data there is we would still not be able to predict subjective experiences of fatigue and muscle impairment, i.e. there is too much randomness involved to make any sensible prediction.
Nonetheless, we both learned a lot - about medicine, muscles, our own bodies, data privacy, interactive design and - last but not least - art-science collaboration. However, if you are reading this and have ideas for improvement or think you have spotted some 'mistakes' in the way we approached things (feel free to also take a look at our code which is open source), we would be excited to hear and learn from you. You can just send us an email.